

Purity percentages are quoted everywhere in the research peptide market, but few buyers could say precisely what the number measures. Since the figure decides whether material is usable for serious research, it deserves a proper explanation: how the instrument works, how the number is calculated, what can make it misleading, and what it leaves out.
How HPLC Separates Molecules
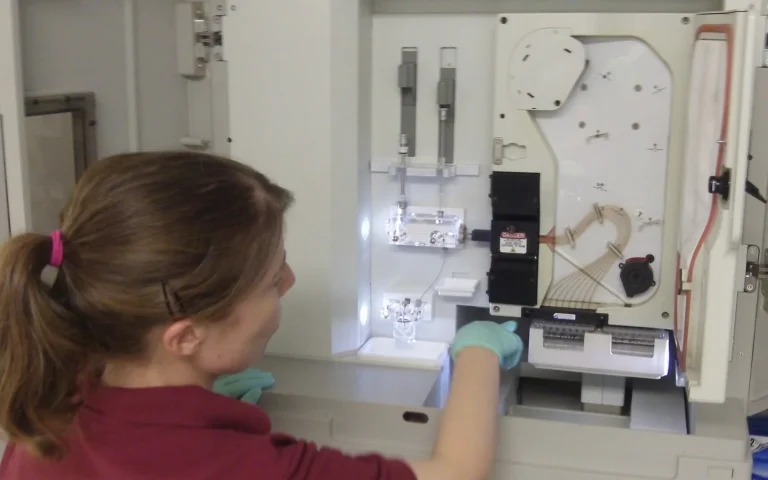
High-performance liquid chromatography dissolves the sample and pushes it through a separation column under high pressure. For peptides the standard method is reversed-phase HPLC: the column is packed with silica particles coated in hydrophobic carbon chains (C18 is the most common), and the mobile phase is water with an increasing proportion of acetonitrile over the course of the run, both containing a small amount of trifluoroacetic acid to sharpen the peaks.
Molecules in the sample stick to the hydrophobic coating with a strength that depends on their own hydrophobicity. As the acetonitrile concentration rises, they are released in order: the most water-loving first, the most hydrophobic last. A peptide missing one residue, or carrying an oxidized methionine, or with a protecting group still attached, has a slightly different hydrophobicity from the intended sequence and so exits the column at a slightly different time. That is what makes the method work: the chemistry of each impurity determines when it appears.
How the Number Is Generated
As molecules exit the column they pass through a UV detector, usually set at 214 or 220 nm, where the peptide bond absorbs. The detector records absorbance against time, producing a chromatogram of peaks. Software integrates the area under each peak, and the purity percentage is the area of the main peak (the target peptide) divided by the total area of all peaks. A 99% figure means 99% of the detected UV-absorbing material eluted as the intended sequence.
Three details of this calculation matter.
Area, not height. A tall narrow peak and a short broad peak can hold the same amount of material. Integration uses area.
Detection wavelength. At 214 nm every peptide bond absorbs about equally, so area is roughly proportional to the amount of peptide regardless of sequence. At 280 nm only tryptophan and tyrosine absorb, so an impurity lacking those residues would be invisible. A COA should state the wavelength; 214 or 220 nm is the right choice for purity.
Integration choices. Where the analyst draws the baseline, and whether small shoulders are split from the main peak or merged into it, changes the number. This is why the chromatogram should accompany the percentage: it lets you judge whether the integration was honest.
What Lives in the Other 1%
The minor peaks are typically deletion sequences (one residue missing, the commonest synthesis failure), truncated sequences from chains that stopped growing, incompletely deprotected peptides, oxidized or deamidated variants, and diastereomers where one residue flipped to the D-form. Our article Understanding Peptide Purity covers what each of these does to an experiment. For most research purposes a 99%+ profile is the accepted standard; materially lower figures introduce variables a controlled study cannot account for.
What the Number Does Not Include
HPLC purity is a ratio among the things the detector can see. It does not count counter-ions (acetate or trifluoroacetate left from synthesis, which can be 10–20% of the powder’s mass), water, or inorganic salts, none of which absorb at 214 nm. A “99% pure” peptide may be 75–85% peptide by weight. Nor does it count anything that fails to elute within the run or that is retained on the column. Net peptide content, measured separately by amino acid analysis, is the figure to use for molar calculations; see What a COA Tells You.
Ways the Number Can Mislead
- Co-elution. If an impurity has nearly the same hydrophobicity as the target, the two exit together and are counted as one peak. Deletion of a small residue (glycine, alanine) is the classic case. A shoulder on the main peak, or a main peak that is broader than expected, is the tell.
- Too fast a gradient. A short run compresses the peaks together and hides minor ones. The method section should show a gradient long enough to resolve them, typically 20–30 minutes for a research peptide.
- Generous baseline. Drawing the baseline above small peaks excludes them from the total and inflates purity.
- Wrong wavelength. Measuring at 280 nm hides impurities without aromatic residues.
A certificate that shows its method and its chromatogram lets you check all four. One that shows only a number does not.
Purity Is Not Identity
A common misunderstanding: purity alone does not prove the compound is what the label claims. A vial can be 99% pure of the wrong molecule, and HPLC cannot tell the difference, because retention time is only suggestive. Identity requires mass spectrometry, which measures the molecular mass directly and compares it with the theoretical mass of the intended sequence. That is why a complete Certificate of Analysis reports both, and why the two instruments are discussed together in Inside Third-Party Peptide Testing.
Purity Over Time
The percentage on the certificate describes the material on the analysis date. Oxidation, deamidation, and hydrolysis continue slowly in storage and quickly in solution, so the same vial re-tested months later would show a lower figure. Proper storage keeps the gap small; this article covers the chemistry.
Our Standard
Every Pristine Aminos batch is independently tested by HPLC and mass spectrometry, with COA documentation including the chromatogram on the Testing page. If a supplier cannot show you the chromatogram behind the claim, the claim is marketing.
All products referenced are intended strictly for in-vitro research and laboratory use only. They are not for human or veterinary use, consumption, or therapeutic application.